
The technician comes back from sampling with a notebook full of figures, and that afternoon has to write up how many infested fruits there were in each plot, at what stage and at which point. Agricultural pest monitoring is that same job done with a method: always walking the same plots in the same way, recording which pest is present, how much and where, and comparing each reading with its threshold and with the treatments already applied. Below you will find what to prepare, the steps in order, a table with the data for each observation, the mistakes that make a sample worthless, and how it works in Agrimaps.
What pest monitoring is and how it differs from sampling
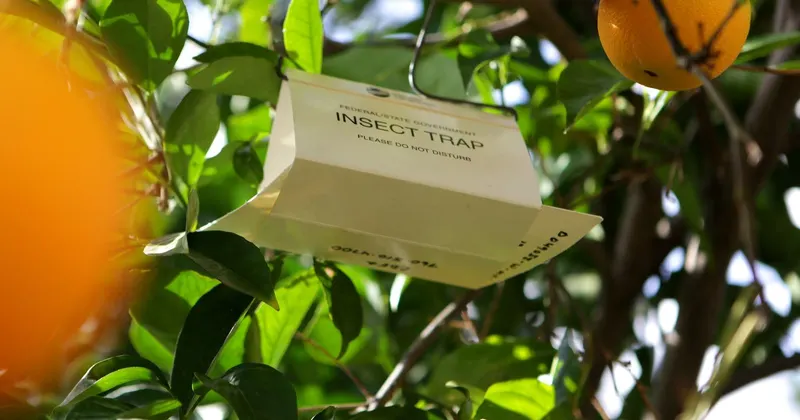
On the farm the two words are used almost as synonyms, and it is worth separating them because they are recorded differently. Sampling is direct observation: you look at the plant, the leaf or the fruit and count what you see. Trap monitoring measures catches, that is, how many individuals fall into each trap between one check and the next.
The two kinds of reading are cross-checked against the same treatment calendar and together they give you the plant health status of the plot. With only one you are missing half the picture: the trap warns you that a pest is on the wing, and sampling tells you whether it is already in the crop and in what numbers. If you work with traps, you will find the details in the article on how to record pheromone trap catches.
What you need to prepare before going out into the field
Half the work is done in the technical office, before setting foot in the plot. Prepare the following:
- The list of plots you are going to sample, with the name or code they have in the field logbook, so that each piece of data later lands in the right place.
- The pests you are watching for in each plot and at what point in the season, depending on the crop and its phenological stage.
- The type of sampling for each pest: extensive, intensive (leaf by leaf) or fruit-based.
- The minimum and maximum thresholds you have defined for each pest. If you are unsure how they are set, see the article on intervention thresholds and when to treat a pest.
- How many plants, leaves or fruits you will examine in each plot. That number stays the same from one visit to the next.
- A charged phone with location services on or, if you are still on paper, a sheet with the columns already printed.
How to monitor agricultural pests step by step
Set the route and repeat it
Decide where you enter the plot and which rows or trees you examine. If each visit is made by a different person along a different path, readings from two consecutive weeks cannot be compared. Leave the route written down or recorded: the sampling route on the map later shows the path followed by whoever took the samples.
Choose the unit you count
Tree, ring, leaf, fruit or trap. Decide which one works for each pest and keep it for the whole season. Changing unit halfway through the season breaks the series and the chart stops telling you anything.
Count by stage and note the beneficial fauna
Record the presence of the pest separated by stage, and also note any beneficial insects you find in the same sample. A high count with plenty of beneficial fauna reads differently. In the article on how to record beneficial fauna during field visits you will find a simple method for counting it.
Place each observation on the map
Each sample goes with its position and, when something looks unusual, with a photo. “Well plot, north area” is no use to whoever returns the following week. If during the route you see something outside the sampling, such as an irrigation leak or a gap where a plant has failed, leave it in a separate note with its location so it does not get lost among the counts.
Compare with the threshold the same day
The reading is compared with its threshold as soon as it is taken. Waiting to write it up on Friday means deciding late. Below the minimum, you keep watching; between the minimum and the maximum, you step up the frequency of visits; above the maximum, the technician decides what to do.
Cross-check the readings against the treatments
After each treatment, the next reading has to show its effect. For that you need the date and plot of each treatment alongside the series of counts, on the same screen or the same sheet. Without that cross-check, monitoring is just a list of numbers.
What data to record in each observation
This table works equally well for a spreadsheet or an app. Every missing column takes value away from the data.
| Data | What it is for |
|---|---|
| Date and person sampling | Knowing who took the data and ordering the series |
| Farm and plot | Linking the sampling with the field logbook and with the treatments |
| Family, pest and type of sampling | Comparing only readings taken with the same method |
| Units sampled | Calculating percentages that can be compared between visits |
| Presence by stage | Seeing where in its cycle the pest is |
| Beneficial insects | Reading the count alongside the biological control present |
| GPS position and photo | Returning to the exact spot and showing what was seen |
| Observations | Recording the context: phenological stage, weather, anything out of the ordinary |
Is a pest monitoring spreadsheet in Excel enough?
A spreadsheet holds up as long as one person fills it in, on one farm, and someone keeps it up to date. It breaks down when there are several technicians, several farms and the data comes from a notebook that gets copied up in the afternoon: typing errors creep in, the position ends up as “somewhere near the well”, the photos are on another phone and the cross-check with the treatments is done by hand.
If you are going to stick with a spreadsheet, use the columns from the table above and one tab per plot, with the date of each treatment next to the counts. That said, if what eats up your afternoon is writing everything up, the spreadsheet will not fix it: what fixes it is capturing the data once, in the field.
That is the job Agrimaps does: the technician records each sample in the app with its GPS position and in the office it appears in the web panel coloured according to the threshold, with the treatments alongside. If you would like to see it with your own plots, request a no-obligation demo.
Paper records of plant protection treatments are accepted until 31/12/2026 and from 01/01/2027 they must be kept in electronic format (art. 16.1 of Real Decreto 1311/2012 (Spanish Royal Decree on sustainable use of plant protection products), amended by Real Decreto 1039/2025, BOE (Spanish Official State Gazette) of 20/11/2025). The full digital field logbook remains voluntary until the next CAP (Common Agricultural Policy) framework (Real Decreto 34/2025).
The data each treatment must include is covered in the article on the plant protection treatment record and its mandatory data.
Common mistakes that make a sample worthless
- Changing the number of units sampled from one visit to the next and comparing the totals as if they were equivalent.
- Mixing extensive and intensive sampling in the same column.
- Writing the plot down under different names depending on who is sampling, so that it later fails to match the field logbook.
- Leaving the count without stages, as a loose number that does not say whether the pest is starting or ending.
- Forgetting to put the treatment next to the series and ending up not knowing whether it worked.
- Writing up the data days later, when you no longer remember what you meant by that mark in the margin.
What pest monitoring looks like in Agrimaps
In the Android or iPhone app you choose the location, the family, the pest and the type of sampling (extensive by ring, intensive leaf by leaf, or fruit), and you record presence by stage, GPS position, observations and images. While sampling you can consult the pest datasheet. Records stay pending on the device until you send them to the server and, once sent, they can no longer be edited.
In the web panel, each sample in the table is coloured according to the thresholds: red if it exceeds the maximum, yellow if it exceeds the minimum without reaching the maximum, and green if it is below the minimum. That way you can see at a glance which plots need a return visit sooner.
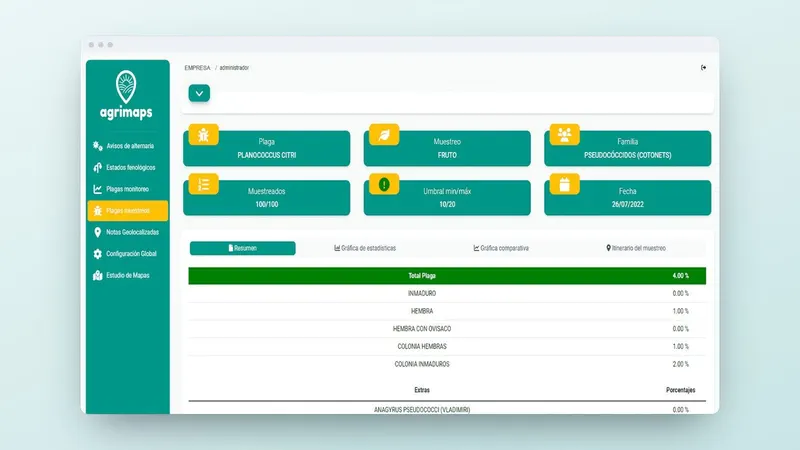
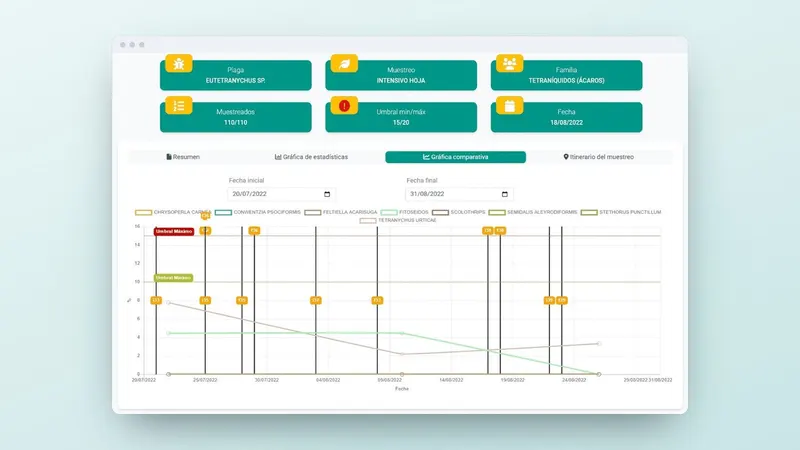
The comparison chart shows the evolution of the pest in a plot with its thresholds and with the treatments applied as vertical black lines. It is the cross-check of readings and treatments from this guide, done without touching a spreadsheet: the effect of each treatment can be checked at a glance.
For traps, pest monitoring shows the evolution of catches per trap and day with the thresholds and treatments; in the app, the days of capture and the catches per day are filled in automatically. The sampling route appears on the map, and anything you see outside the sampling goes into a geolocated note with a photo and location. You will find all the screens on the page for pest sampling and monitoring in Agrimaps.
What to do now to start this season's monitoring
- Make the list of plots, pests, type of sampling and threshold for each, and set how many units you will examine.
- Define the route for each plot and make the first visit with the data table from this guide.
- Decide where that data is going to live. If you want to capture it just once in the field and see sampling, threshold and treatments on the same chart, request a no-obligation Agrimaps demo or call +34 959 54 07 12.