
A pheromone trap is only useful if someone checks it regularly and writes down what they find. Hung up and forgotten, or with readings jotted on a piece of paper nobody looks at again, it adds nothing to the decision to treat. This article covers how to organise the traps on your farm, what data to record at each check and how to read the catches over the course of the season.
What a pheromone trap is for
Sex pheromones attract the males of one specific species. That is why a pheromone trap is a very targeted monitoring tool: it tells you whether that pest is flying on your farm, when the flight starts, when it peaks and when it declines.
What it does not tell you is how many individuals there are in the plot or how much damage they will cause. Catches are an indicator of activity, and how you interpret them depends on the pest. For many pests, the flight helps you pinpoint when it is worth starting to sample fruit or shoots, or adjust the date of an intervention. How the number of catches translates into a decision is set out in the integrated pest management guidelines for each crop, by early-warning stations and by your adviser.
Before you start: organising the traps
A good record starts before the first reading. Each trap needs its own identity, which stays the same throughout the season.
- Give each trap a code: for example, the farm, the plot and a number. That code goes on the trap and in the record.
- Note where it is: plot, row and tree, or better still its position on the map. If you move the trap, the data series is no longer comparable.
- Write down which pheromone it carries and for which pest, along with the date it was set up.
- Set the replacement date for the lure and the sticky base according to the manufacturer's instructions. An exhausted lure gives low catches that do not reflect reality.
- Decide how often you will check and stick to it. The usual approach is to check at a fixed interval, shorter during flight periods.
What to record at each check
Each reading should leave you with the following data. With it you can reconstruct the season and justify any decision.
| Data | Why it matters |
|---|---|
| Trap code | Lets you follow the series for each point |
| Date of the check | Without a date there is no flight curve |
| Days since the previous check | To calculate catches per day and compare readings |
| Number of catches of the target species | This is the main data point |
| Whether the base was emptied or replaced | Avoids counting the same insects twice |
| Lure replacement | Explains jumps in the series |
| Who took the reading | Helps spot differences in criteria |
| Observations | Trap fallen, wet, covered in dust, other species |
Catches per day, not isolated catches
If one time you check after five days and another after nine, comparing the raw number of catches is misleading. Divide the catches by the days elapsed since the previous reading. That gives you a value per trap per day that you can compare between weeks, between plots and with official warnings, which are usually expressed this way.
For example, 18 catches in 6 days is 3 per day; 21 catches in 7 days is also 3 per day. At first glance it looked as if they had gone up, but the rate is the same.
How to read the catches
Once the readings are in date order, the flight curve starts to tell you things:
- First catches: they mark the start of the flight. Many monitoring strategies take that moment as the reference point to start observing sensitive organs.
- Rise and peak: they indicate the period of greatest activity. For several pests, the decision to intervene is linked to this stage, always following the criteria in the reference guidelines.
- Decline: it may be the end of a generation or an effect of the weather. If it rises again, another one may be starting.
- Differences between traps: if one trap catches far more than the others, there may be an outbreak in that area or a problem with the trap.
Always compare your curve with the bulletins from the early-warning station in your region. If the warnings report the start of the flight in your area and your traps are still at zero, check that they are well positioned and that the lure is not exhausted.
Common mistakes with traps
- Not emptying the trap after counting, and counting the same insects again at the next reading.
- Moving the trap mid-season without noting it down.
- Confusing similar species. If in doubt, keep a sample or take a photo and ask for advice.
- Checking without a fixed interval and not recording the days elapsed.
- Missing the lure replacement date.
- Keeping readings on loose sheets of paper that are never transferred anywhere.
- Deciding on the trap alone, without sampling the affected organs when the guidelines require it.
Readings in Agrimaps
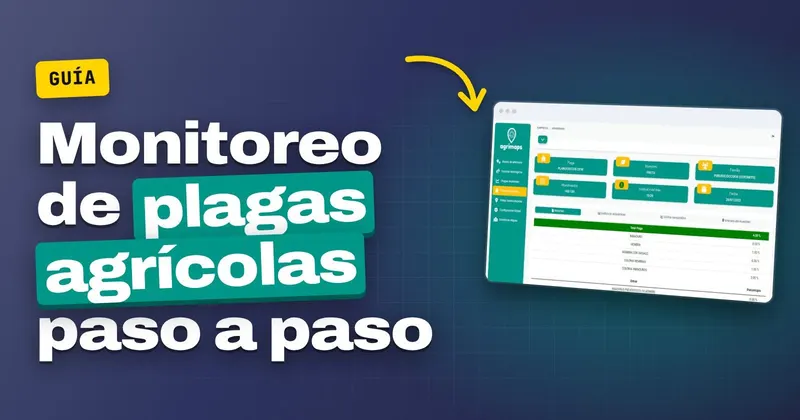
Agrimaps is a geolocated field logbook designed so that what you see in the field does not stay in a notebook. With pest sampling you monitor the status of each pest in each plot, compare it with a minimum and maximum threshold and see it on a comparative chart, alongside how the treatments you carry out affect it. Data is entered from the Android app and analysed in the web version.
If something unusual turns up during a check, such as a fallen trap or a cluster of damage next to one, you can leave it as a geolocated note at the exact spot, so that someone else can reach that point with the Google Maps route and mark it as resolved once it has been fixed.