
Seeing a pest on your farm does not mean you have to treat. The useful question is a different one: has the population reached a level where the damage it will cause costs more than the intervention? That level is the intervention threshold, and knowing how to use it is what separates a justified treatment from one done just in case. This article explains what it is, where thresholds come from, how to compare them with what you see in the field and which mistakes are best avoided.
What an intervention threshold is
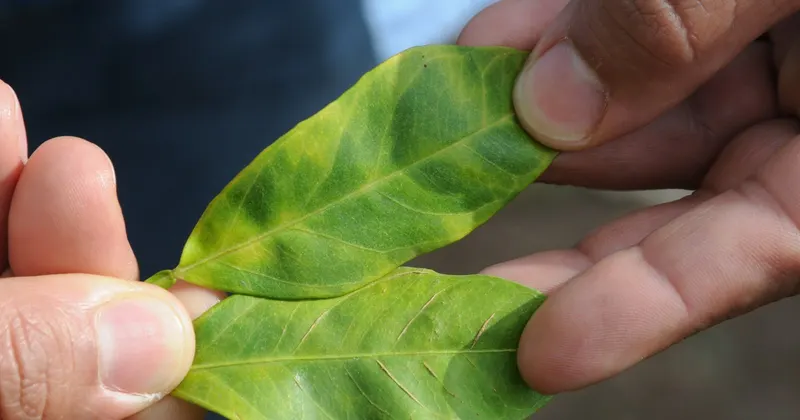
An intervention threshold is the pest level from which taking action is justified. It is expressed in different ways depending on the pest and the crop: percentage of leaves, shoots or fruits infested, number of individuals per organ, catches per trap per day, or the presence of a specific symptom at a given phenological stage.
It is not a universal number. It changes with the crop, the variety, the point in the season, the intended use of the fruit and the presence of natural enemies. That is why the same pest level may justify nothing at one moment and be a reason to intervene a few weeks later, when the fruit is more sensitive.
It is worth distinguishing two ideas that are often mixed up:
- Economic injury level: the pest level at which losses equal the cost of controlling it.
- Intervention threshold: a slightly lower level, which leaves room to act before that damage is reached, because the population keeps growing while you prepare your response.
Where thresholds come from
Real Decreto 1311/2012 (the Spanish Royal Decree on the sustainable use of plant protection products), includes in its annex I the principles of integrated pest management. One of them states that the decision to apply a measure must be based on the results of monitoring and, where they exist, on scientifically sound thresholds.
In practice, the most reliable references are these:
- The integrated pest management guides of the Ministry of Agriculture, published by crop on the website of the Ministerio de Agricultura, Pesca y Alimentación (Spain's Ministry of Agriculture, Fisheries and Food). They describe the sampling method and the intervention criteria for each pest.
- The warning stations and plant health alert networks of your autonomous community, which adjust the criteria to the area and to how the season is going.
- The integrated production regulations of your community, if you produce under that certification.
- Your integrated pest management adviser, who adapts all of the above to your farm.
This article deliberately gives no threshold figures: they depend on too many factors and change from one area to another. The specific value must come from those sources and from your adviser.
How to compare the field with the threshold
A threshold is only useful if the data you compare it with has been collected in the same way as the data used to define it. If the guide refers to the percentage of infested fruits in a sample of one hundred fruits, counting eight fruits on one tree as you walk past does not count.
- Use the sampling method from the reference: the organ to observe (leaf, shoot, fruit, flower), the number of trees and organs, and how they are distributed across the plot.
- Sample by homogeneous units: a plot with different varieties or ages may need separate sampling.
- Respect the frequency: in risk periods, sampling is usually more frequent. A single reading says little; the trend says much more.
- Also record what is not there: a sample with zero individuals is as valuable a data point as one with presence.
- Record beneficial fauna: if natural enemies are active, the decision may be to wait and sample again.
Example of a reading
For example, imagine a citrus plot where the reference method asks you to check a fixed number of young leaves and note how many have mites. If in three consecutive samplings the percentage rises slowly but stays below the threshold, and predatory mites also appear, the sensible thing is to keep monitoring. If in the same situation the percentage shoots up from one week to the next and exceeds the threshold, it is time to talk to your adviser to decide on the measure.
Common mistakes
| Mistake | What it causes | How to avoid it |
|---|---|---|
| Treating on seeing the pest, without counting | Unnecessary treatments and a higher risk of resistance | Sample using the reference method before deciding |
| Sampling only the most affected area | Overestimating the population of the whole plot | Spread the sampling points across the whole plot |
| Using a threshold from another area or crop | Decisions that do not fit your farm | Consult the warning station for your area and your adviser |
| Not keeping the samplings | Being unable to justify the decision or compare seasons | Record each sampling with date, plot and result |
| Not sampling again after treating | Not knowing whether the measure worked | Schedule a follow-up sampling |
After deciding: checking the effect
The last principle of integrated pest management is to evaluate whether the measures have worked, based on the records of product use and on pest monitoring. In other words: after an intervention, you need to sample again and see what has happened to the population.
That check serves three purposes. It tells you whether the measure was effective or needs rethinking. It warns you of possible resistance problems if the population does not fall as you expected. And it documents that the decision was made with sound judgement, something you may be asked for in an inspection or in an integrated production or Global G.A.P. audit.
Quick checklist for every decision to treat:
- Date and plot of the sampling that justifies it.
- Pest, sampling method and result.
- Reference threshold and where it comes from.
- Adviser's recommendation.
- Follow-up sampling afterwards.
Thresholds and samplings in Agrimaps
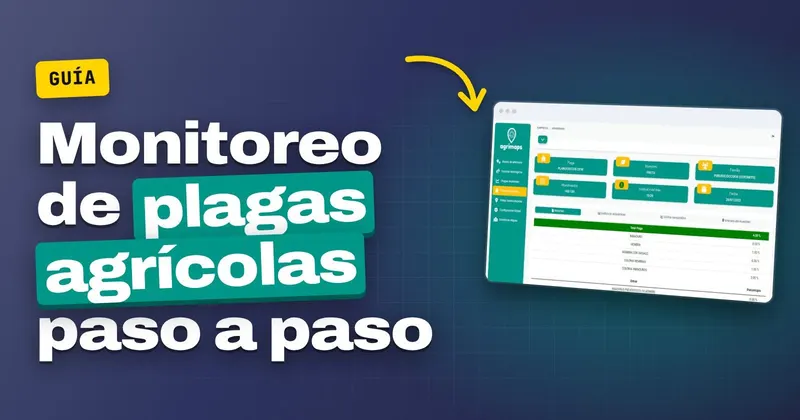
Agrimaps is a geolocated field logbook. Its pest sampling feature lets you monitor the status of the pests present in each plot and compare it with a minimum and maximum threshold, using a comparative chart. You can also see how the treatments you carry out affect that status, which is precisely the follow-up check we were talking about.
Data is entered from the Android app in the field and analysed in the web version. If during a visit you find something that does not fit the sampling, you can leave it as a geolocated note at the exact point on the farm. And the treatments you decide to carry out are kept in the technical operations tracking, with the person responsible, so you can generate the field logbook with one click.